GES Modules
Production Analysis
Among all 2D geology evaluation step, only production data is the most direct reflection of the subsurface geology. Users like to overlay production analysis to double check static geology result. GES provide production curve and production map to help users.
Production Curve
GES offers Production Curve tool to allow production data visualization for individual wells.
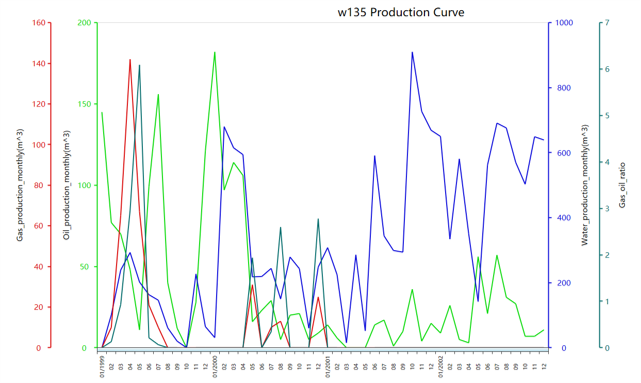
Fig. Production curve of well w135
Steps to perform Production Curve in GES:
· Go to Geological Evaluation scenario/Geology & Modeling Scenario → Geology Evaluation → Production Curve
· Select data for Data Type → Select a well for Well Name → Check the data you want to display in Data Fields → Set Date Range → Input Title → Click OK
Production Map
Production map utilizes bubble map or bar chart to display production data on a map. It is usually shown with property maps such as net pay map and isochore map to provide an independent verification of any geological evaluation. GES provide two different production maps, bubble map and bar chart.
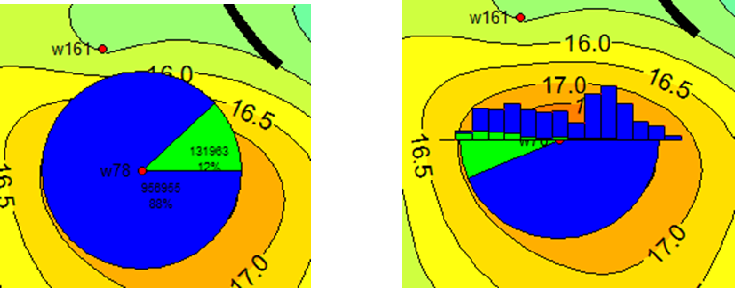
Fig. Production curve of well w135
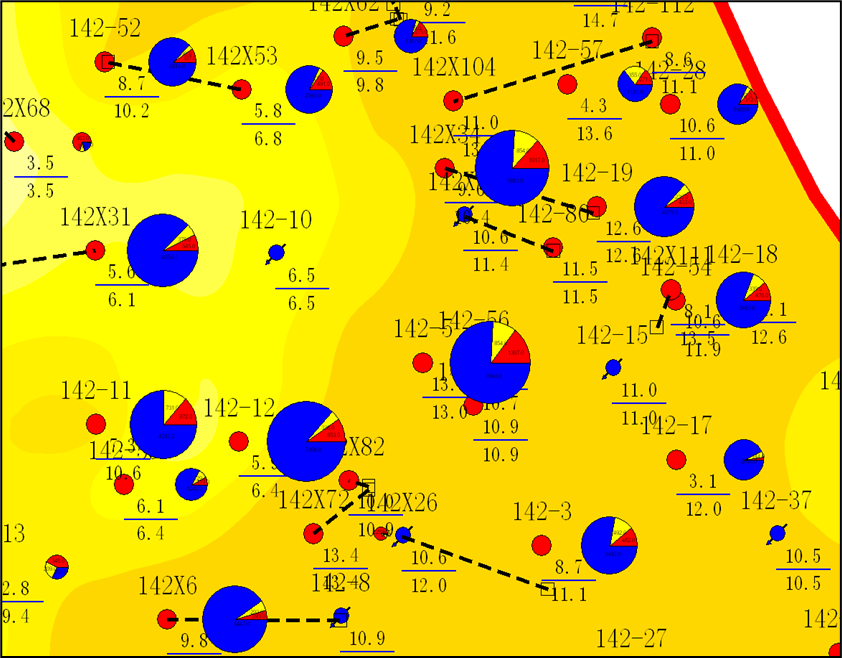
Fig. Bubble map overlay with sand map
Steps to perform Production Map in GES:
· Go to Geological Evaluation scenario/Geology & Modeling Scenario → Geology Evaluation → Production Map
· Input Map name → Check Bubble Map or Bar Chart → Select data for Data Fields → Select Well → Set Start Date and End Date → Click OK